Getting Started with Resource Analyzer
This guide walks you through your first resource analysis using Resource Analyzer.
Prerequisites
Before starting your analysis, you will need:
- A quantum resource estimate (QRE) file (
filename.qre-analysis). You can use one of the sample QREs on the Resource Analyzer home screen ⧉, or a QRE file that you've generated from Workbench (see more about generating QREs from Workbench here) - Google Chrome browser (recommended for optimal performance)
Opening a QRE file in Resource Analyzer
- Open Resource Analyzer ⧉
- Select the QRE to view:
- Option 1: Click on one of the sample QREs
- Option 2: Click the Open File option and choose a QRE file that you created in Workbench from your computer.
- You will now be viewing a QRE in the Call Graph view
Understanding the Interface
The Resource Analyzer interface consists of:
- Toolbar - Contains controls for opening QREs, visualization settings, and download options
- Visualization Area - Displays the resource estimation graph
Within the Toolbar you will find:
- QRE Menu - Supports opening QREs, downloading QREs, exiting, and sign-on
- Graph Settings - Configure visualization options to change the resource estimation graph
- Graph Type Selector - Choose between either a Call Graph or Flame Graph
- Metric Selector - Choose which resource metrics to display, including All Resources
- Expand/Collapse - Expand or collapse all subroutines in the resource estimation graph
- Zoom - Zoom in or out of the resource estimation graph
- Download - Download images (PNG or SVG) of the current view or download the QRE file itself

Your First Analysis
-
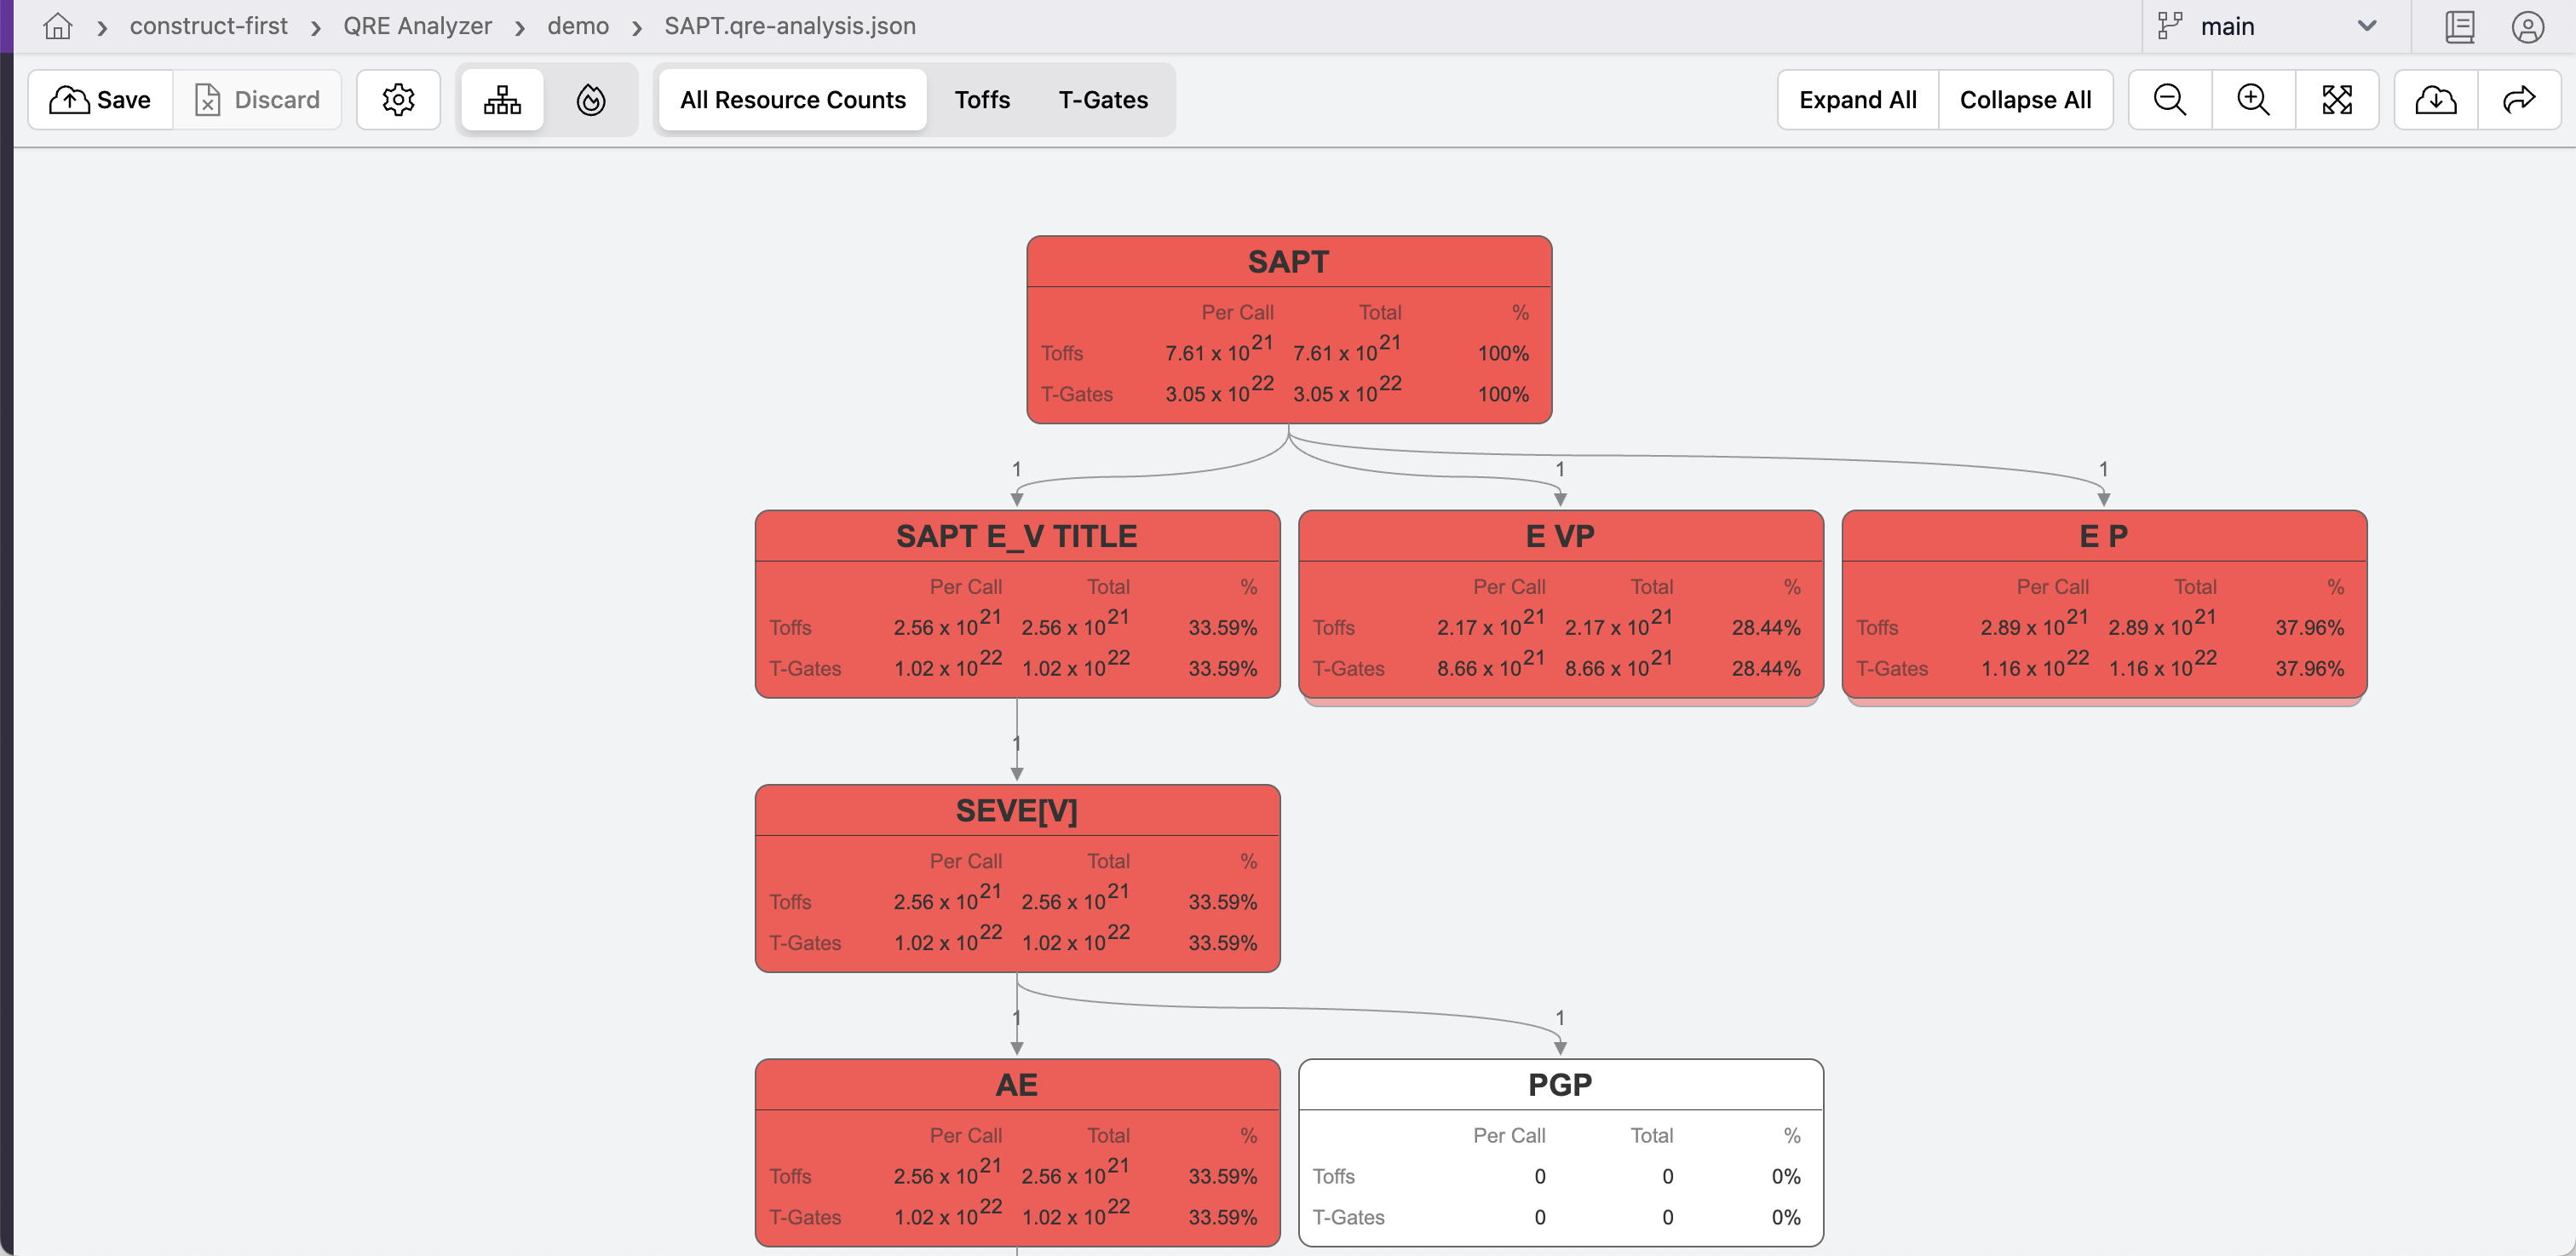
Explore the Graph
- The visualization automatically displays the call graph view of your QRE
- Each box represents a subroutine
- Darker colors indicate higher resource counts
- Lines show the calling relationship between components, with parent subroutines above child subroutines
-
View Resource Metrics
- Click "All Resource Counts" to see all available metrics. The metrics available are those used by the algorithm when the QRE was generated in Workbench.
- Select specific metrics like "Toffs" or "T-Gates" to focus only on those resource types
-
Identify Hotspots
- Look for darker colored boxes indicating high resource counts
- Note the "Per Call" and "Total" resource counts.
- Examine the percentage contribution to total cost
Performance Tip
For large resource estimates, use the "Hide gates" option and cost filters to improve visualization performance. See all our Resource Analyzer's filering options here.
Saving QRE Visualizations
- Export an image visualization using the QRE menu or the Download options. This will create a PNG or SVG image of your current view.
- Download the QRE file using the QRE menu or Download options. This will save a local copy of the QRE file that you are visualizing.
Next Steps
After completing your first analysis, dig deeper into Resource Analyzer features:
- Learn about different visualization types
- Explore display and view settings
- Review sharing and export options