Display and View Settings
Resource Analyzer provides various visual filters and customization options to help focus your analysis.
Graph Setup
Access graph settings by clicking the Graph menu in the toolbar.
The graph setup options control what information is diplayed in the visualization area.
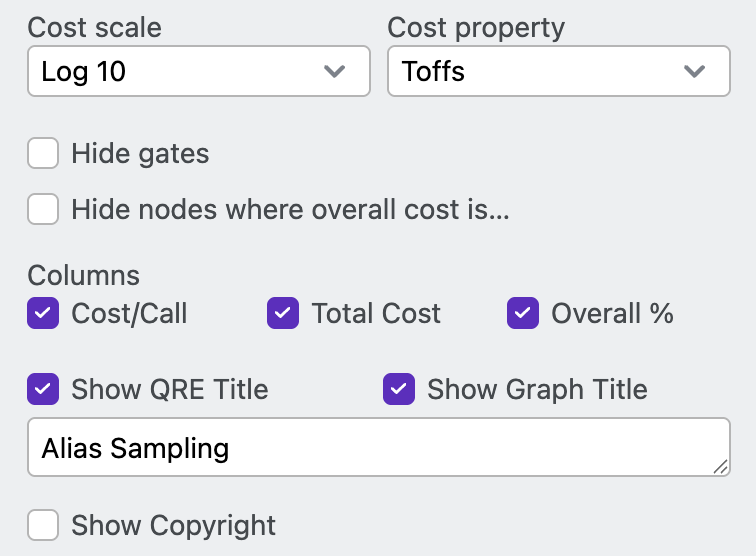
Cost scale
Cost scale determines how the routine color gradients change with resource counts. Options are Log 10 (default value), Log 2, and Linear.
Cost property
Cost property setting is available when All Resources are selected in a Call Graph. This setting determines which resource is used to set the color gradient when All Resources are viewed.
Hide gates
The hide gates checkbox removes individual gate operations from the graph. This helps focus the visualization on the high-level algorithmic structure and improves Resource Analyzer's respsonsiveness when viewing large algorithms.
Hide notes where overall cost is ...
This option removes graph boxes that represent less than a chosen percentage of the overall algorithm cost.
Columns
The columns options (Cost/Call, Total Cost, Overall%) determine which metrics are displayed for each box in a Call Graph.
Show QRE Title
Show QRE Title allows you to create a text title to display atop the visualization area.
Show Graph Title
Show Graph Title checkbox toggles the display of the resource type atop the visualiation area.
Show Copyright
Show Copyright allows you to create a text footer at the bottom of the visualization area.
Additional View Controls
Resource Selector
The toolbar Resource Selector chooses which resource type is displayed in the visualization area.

- Individual resource types can be chosen
- All Resources show all resource types side-by-side for easy comparision
Expansion Controls
- Expand All: Shows complete Call Graph
- Collapse All: Shows only top-level boxes in the Call Graph
- Individual node expansion: Click individual boxes to expand/collapse their subroutines

Zoom and Navigation
Use zoom controls (+/-) to adjust view scale of the visualization area or open in full screen mode.

Next Steps
Learn more about Resource Analyzer:
- Explore sharing and export options