Visualization Types
Resource Analyzer offers two primary visualization types for analyzing quantum resource estimates: Call Graphs and Flame Graphs. Each provides unique insights into your quantum algorithm's resource consumption.
Call Graphs
Call Graphs are the default visualization showing the relationship between different parts of your quantum program.
Understanding Call Graphs
- Boxes represent routines
- Lines show calling relationships between components, with parent routines above child subroutines
- Colors indicate resource intensity.
- Dark Red represents the highest resource usage
- Light Red: Moderate resource usage
- White: Minimal or zero resource usage
- Metrics show resource counts associated with the routine (see more below)
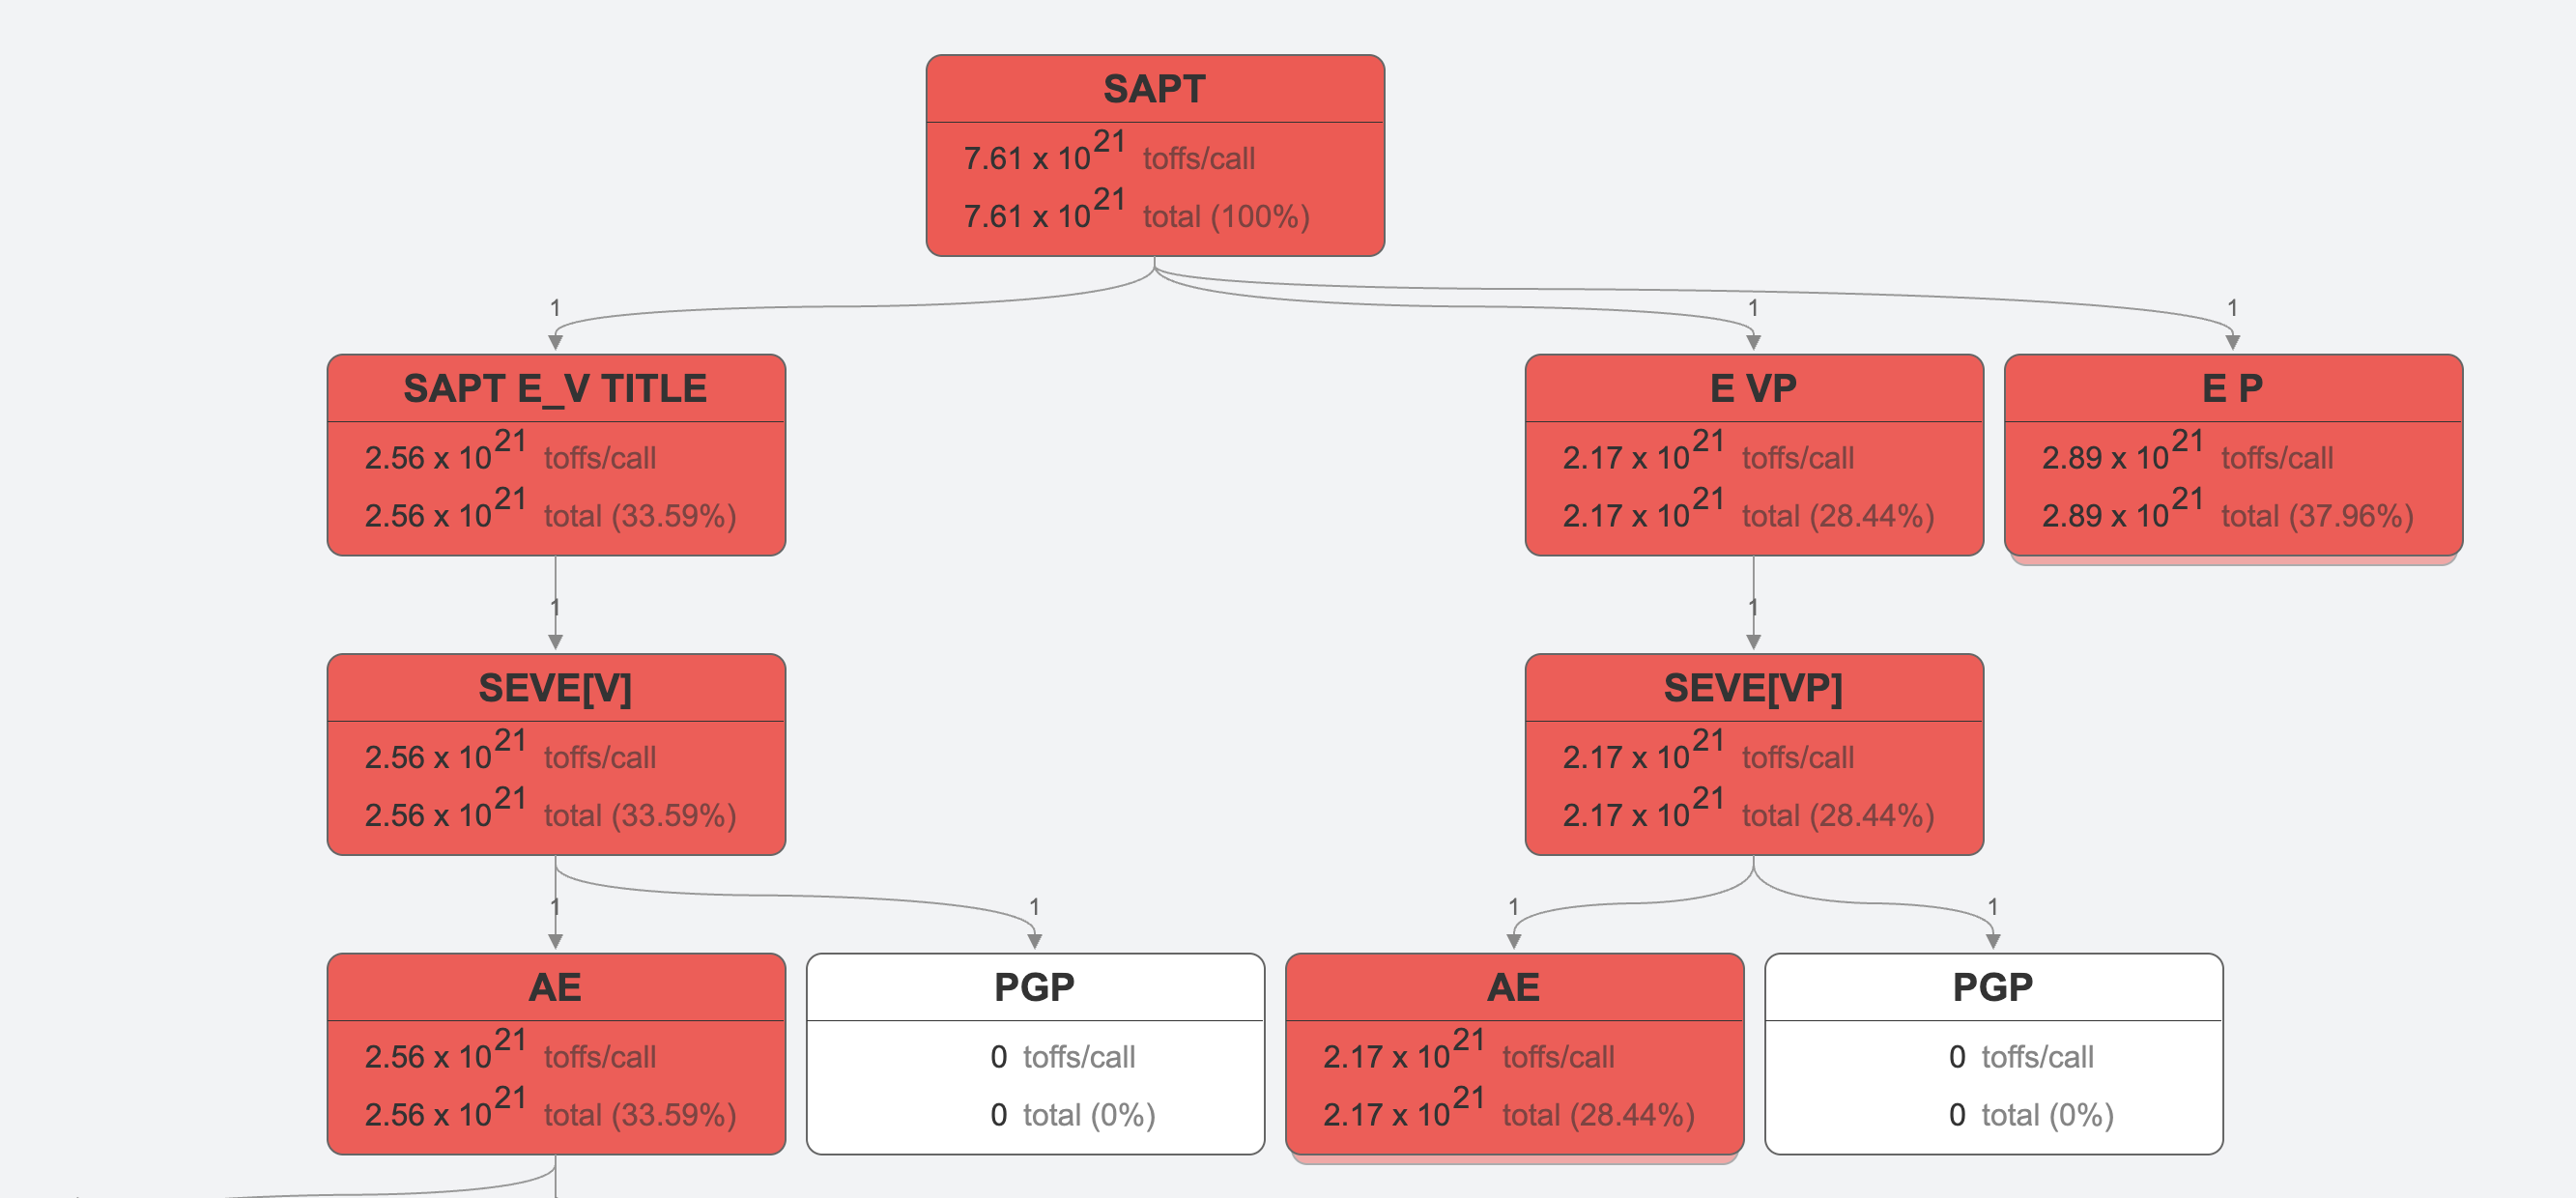
Interpreting Call Graph Metrics
Each box in the call graph shows:
- Routine Name - name of Workbench's Qubrick for this subroutine
- Call Frequency: Times this routine is run per parent routine run
- Per Call: Resources used in a single call to this routine
- Total: Cumulative resources across all calls (Per Call × number of total calls)
- Percentage: Portion of total program resources that this routine presents for a chosen metric
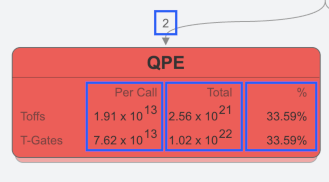
Understanding Resource Scale
Pay attention to scientific notation (e.g., 2.27 × 10¹⁷) when comparing nodes, as resource usage can span many orders of magnitude.
Interacting With Call Graphs
You can interact with Call Graphs to expand and collapse parts of the visual call structure:
- Clicking on individual routines boxes will expand or collapse the call structure below it.
- In the toolbar, you can expand or collapse all routines with a single click.
To further adjust a call graph, you can use metric filters and view options. Learn more.
Flame Graphs
Flame Graphs are an alternative visualization that shows resource consumption proportional to the total program cost.
Understanding Flame Graphs
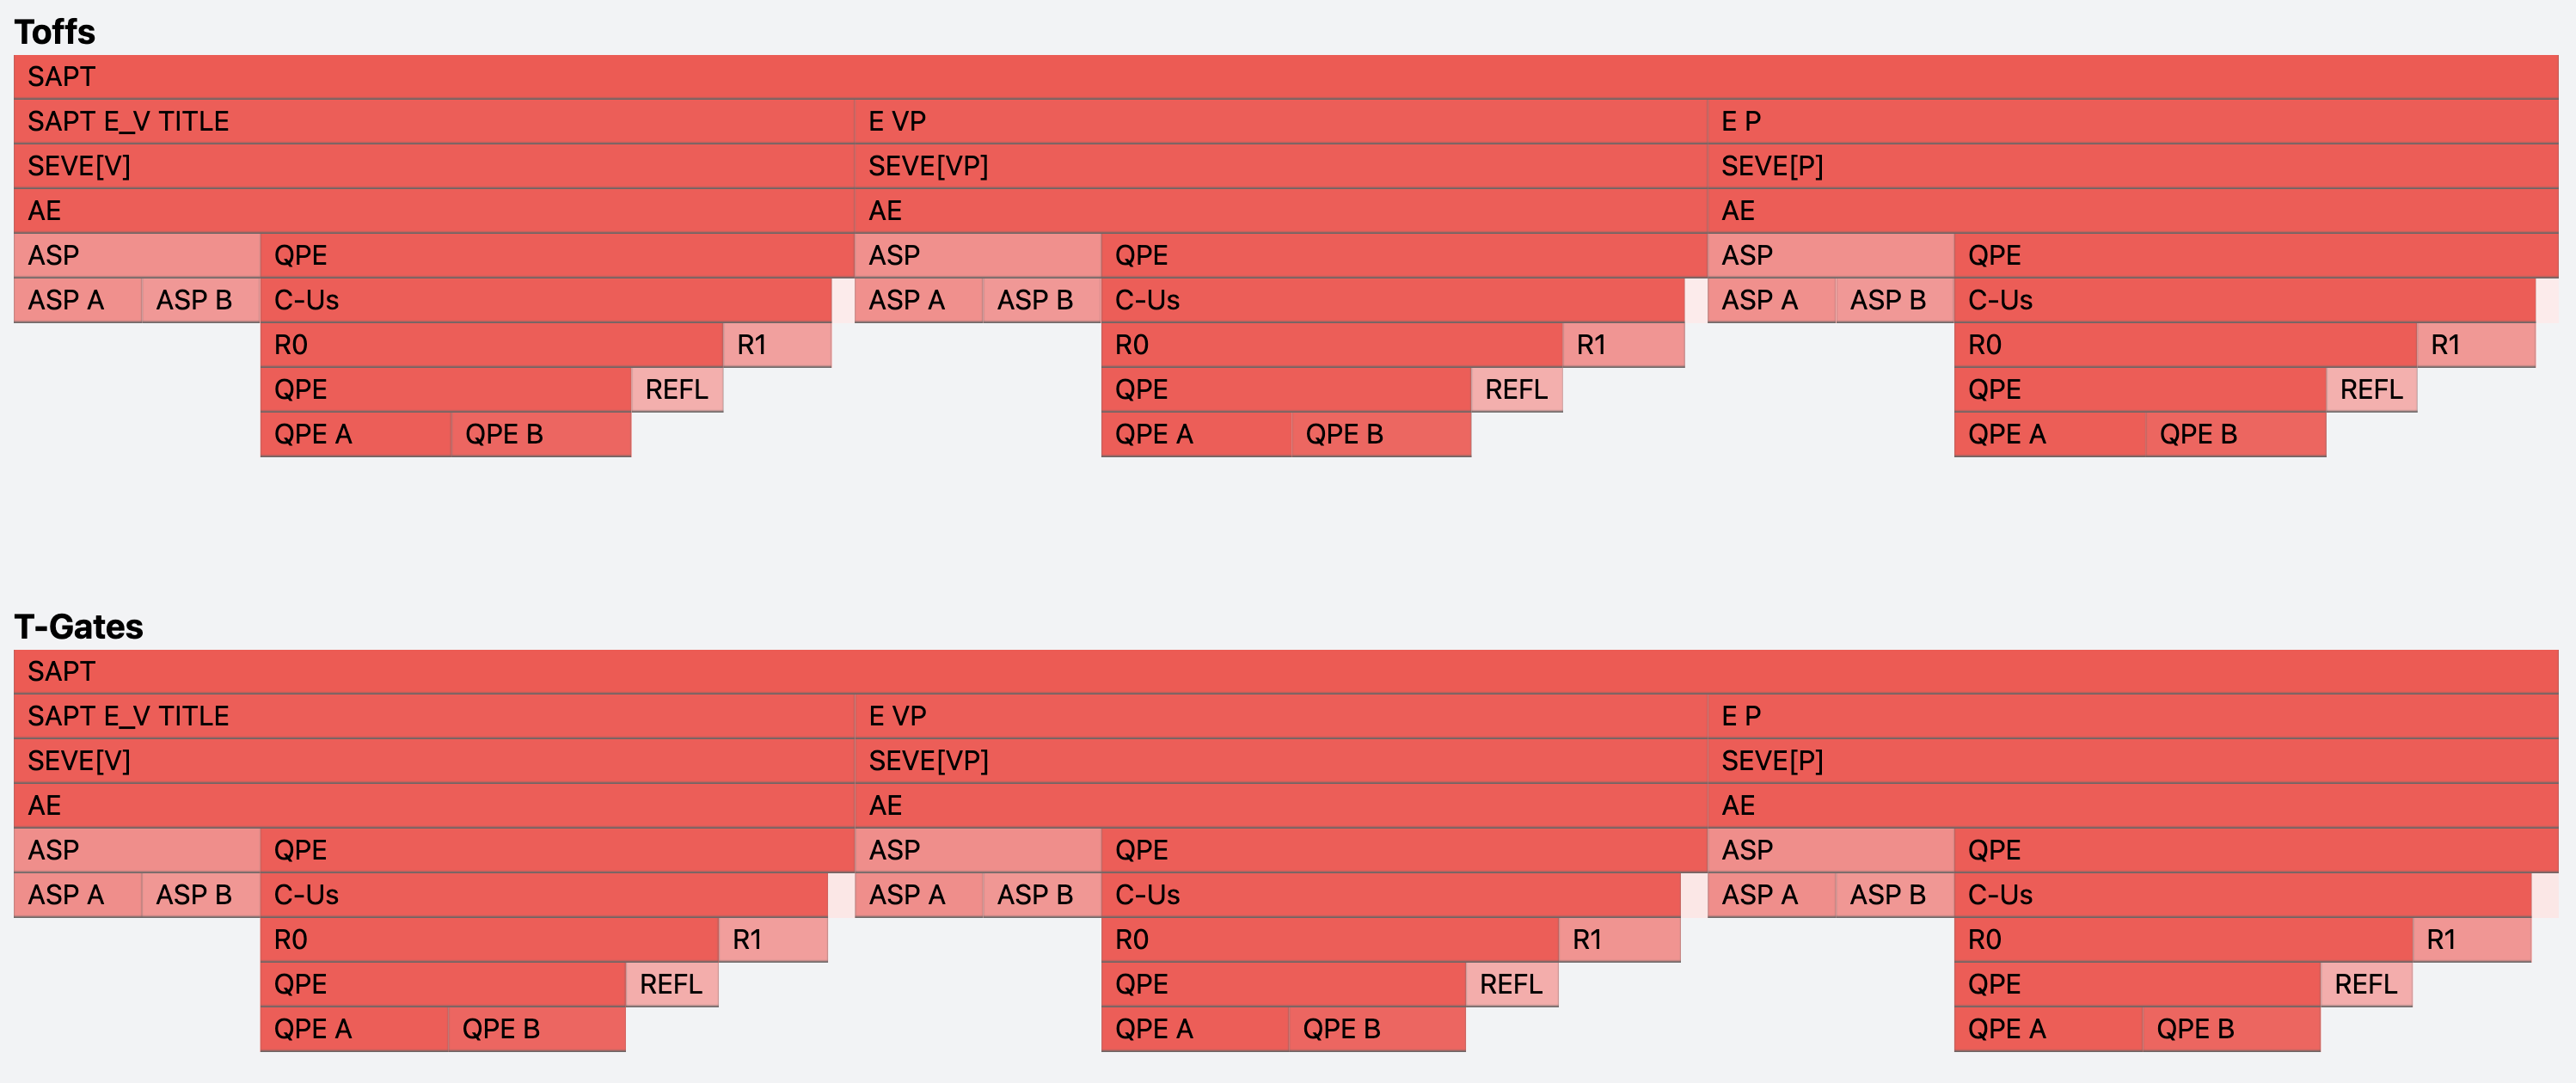
- Horizontal Segments represent individual routines
- Segment Width represents the proportion of total algorithm resources for this routine
- Height shows the routines' call depth in the algorithm
- Colors indicate resource intensity
Interacting With Flame Graphs
You can interact with Flame Graphs to collapse parts of the visual call structure and get more information:
- Clicking on a routine segment will focus that level of the routine hierachy to just that routine. All lower level segments will adjust their width to represent their percentage of this selected routine.
- To see detailed metrics (Per Call and Total resource counts) for a routine, you can hover over its segment.
Switching Between Call and Flame Graphs
Use the visualization toggle in the toolbar to switch between views.
Next Steps
Learn more about Resource Analyzer:
- Explore display and view settings to enhance your analysis
- Read our analysis best practices for using Call and Flame Graphs